
Image by Author | Canva
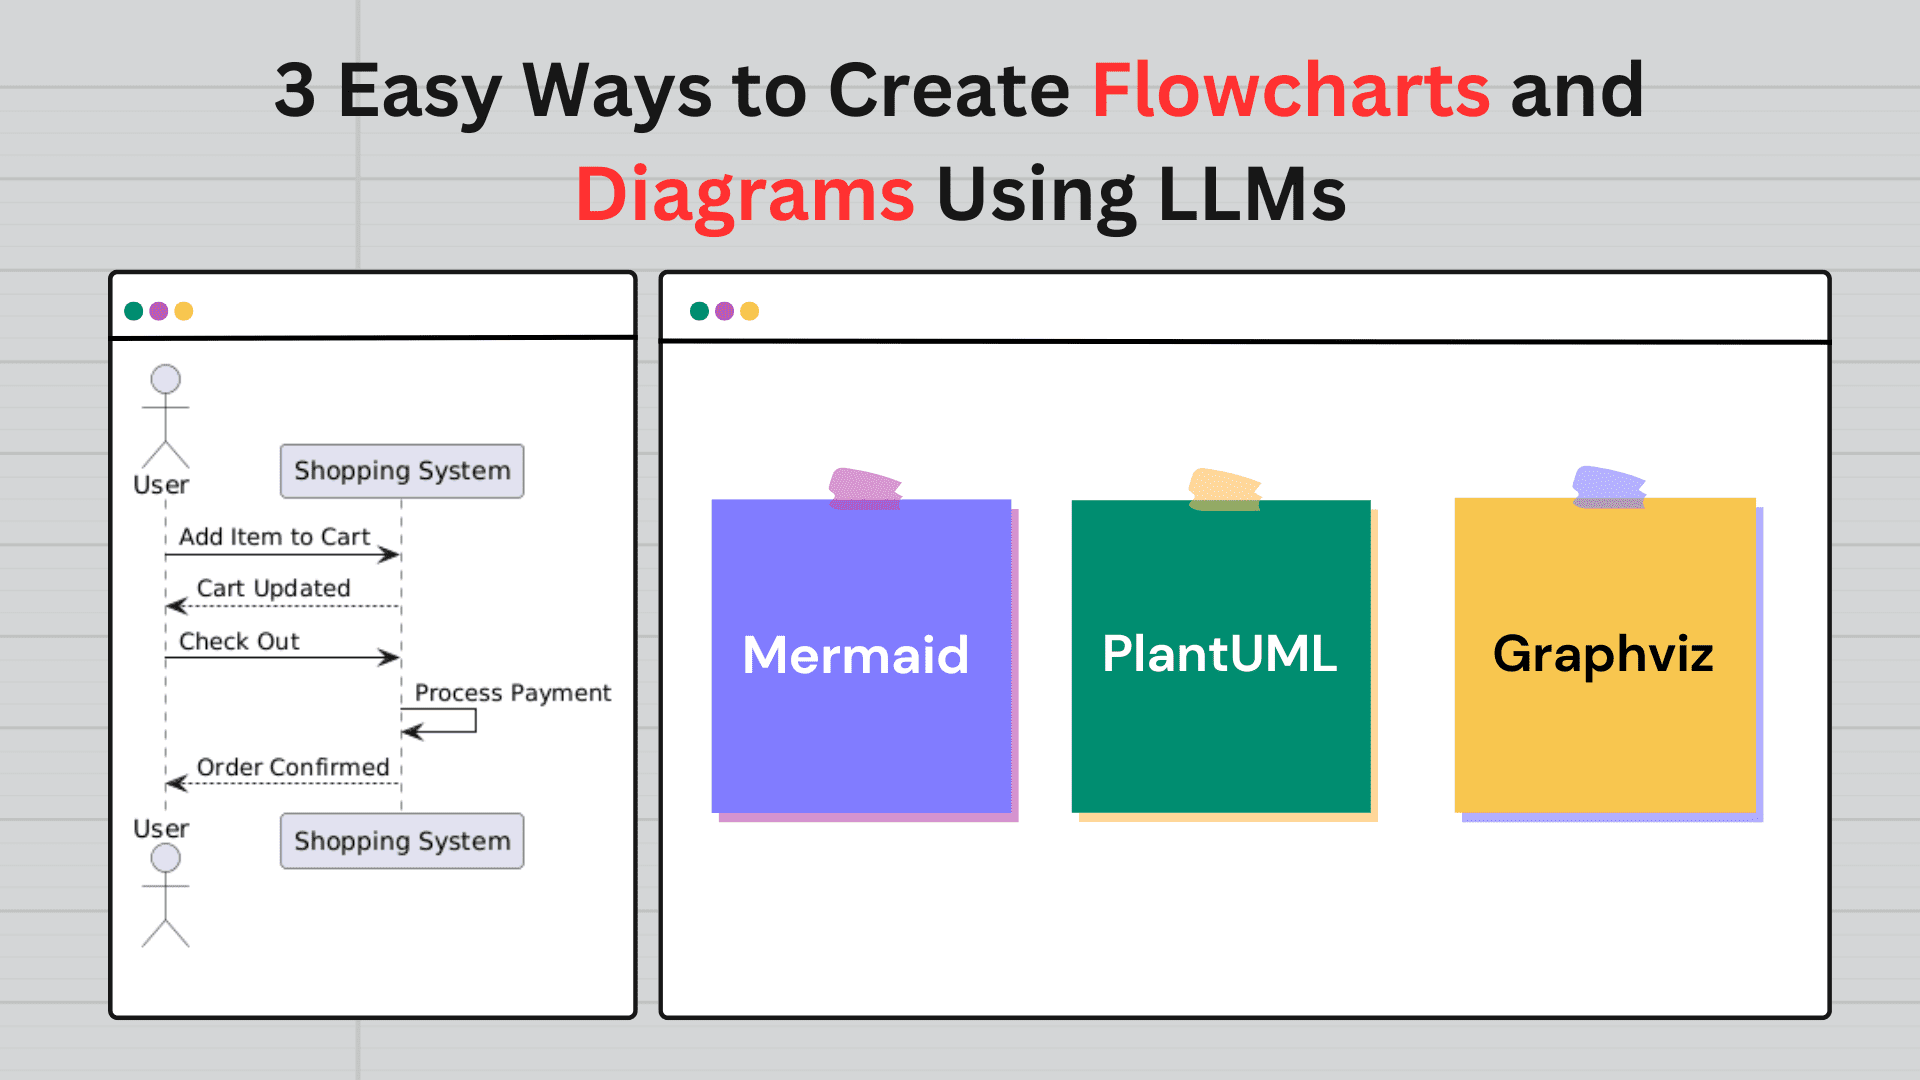
You’ve probably already explored generating images with LLMs. But what about flowcharts and diagrams? These are essential for visualizing processes, workflows, and system architectures. Normally, drawing them manually on online tools can be time-consuming, but did you know that you can automate the process using LLMs with simple text descriptions? It saves you time and effort! In this article, we’ll look at three easy ways to create flowcharts and diagrams using LLMs, complete with practical examples and prompts you can use. So, let’s get started.
Method 1: Using LLMs to Generate Mermaid Code
Mermaid.js is a simple, JavaScript-based diagramming tool that allows you to create flowcharts, sequence diagrams, and more using a Markdown-like syntax.
- graph TD / graph LR: Defines the diagram direction—TD (Top Down) or LR (Left to Right).
- Node Definitions:
A[Text]:Regular node.BCondition:Decision node (diamond shape).C[Text]:Another regular node.- Connections: Use -> for arrows, showing flow.
A --> B:Flow from A to B.B -- Yes --> C:Conditional flow with labels.
Example
- Describe Your Diagram: Start by providing a clear description of the diagram you want to create. For example:
- Ask the LLM to Generate Mermaid Code: Request the LLM (like GPT) to convert your description into Mermaid syntax. For example:
- Render the Diagram: Use a Mermaid-compatible editor like:
"Create a flowchart for a user login process. The steps are: User enters credentials, system validates credentials, if valid, grant access; if invalid, show error message.”
Prompt: "Convert the following process into Mermaid flowchart syntax: [Your Description]"
The LLM might generate:
graph TD
A[User Enters Credentials] --> BSystem Validates Credentials
B -- Valid --> C[Grant Access]
B -- Invalid --> D[Show Error Message]
Paste the generated Mermaid code into the editor to see the flowchart. Simple, right?

Method 2: Using LLMs with Diagramming Tools (e.g., PlantUML)
PlantUML is widely used opensource tool for creating UML diagrams, including class diagrams, sequence diagrams, and activity diagrams.
- @startuml / @enduml: Marks the start and end of the code.
- actor: Defines an actor (a person or external system) in the diagram.
- participant: Defines a participant (an object or system).
- ->: Indicates the flow from one element to another (e.g., from an actor to a system).
- –>: Represents a return message or response.
Example
- Describe Your Diagram: Provide a detailed description of the diagram you want. For example:
- Ask the LLM to Generate PlantUML Code: Use the LLM to convert your description into PlantUML syntax. For example:
- Render the Diagram: Use a PlantUML-compatible editor like:
"Create a sequence diagram for an online shopping process. The steps are: User adds item to cart, system updates cart, user checks out, system processes payment, and order is confirmed."
Prompt: "Convert the following process into PlantUML syntax: [Your Description]"
The LLM might generate:
@startuml
actor User
participant "Shopping System" as System

User -> System: Add Item to Cart
System --> User: Cart Updated
User -> System: Check Out
System -> System: Process Payment
System --> User: Order Confirmed
@enduml
- PlantText
- VS Code with the PlantUML extension.
Paste the generated PlantUML code into the editor to visualize the diagram.

Method 3: Using LLMs with Graphviz DOT
Graphviz is a powerful graph visualization software that uses the DOT language to describe graphs. It’s flexible and supports a wide range of graph types, including flowcharts, network diagrams, and hierarchical structures.
- digraph: Indicates that this is a directed graph (i.e., edges have a direction).
- ->: Defines the flow between nodes.
- [label=”…”]: Adds a label to an edge to specify the relationship between nodes.
- A [shape=box]: Attributes customize nodes or edges
Example
- Describe Your Diagram:Give a clear description of the diagram you want. For example:
- Ask the LLM to Generate DOT Code: Use the LLM to convert your description into DOT syntax. For example:
- Render the Diagram: Use a Graphviz-compatible editor or tool like:
"Create a flowchart for a decision-making process. The steps are: Start, analyze data, if data is valid, proceed; if invalid, retry."
Prompt: "Convert the following process into Graphviz DOT syntax: [Your Description]"
The LLM might generate:
digraph DecisionMaking
    Start -> AnalyzeData
    AnalyzeData -> Proceed [label="Valid"]
    AnalyzeData -> Retry [label="Invalid"]
Paste the generated DOT code into the editor to visualize the diagram.

Tips for Effective Diagram Creation
- Be Specific: The more detail you provide in your description, the more accurate the results will be.
- Iterate: Don’t be afraid to tweak the generated code or structure based on feedback and adjust it as needed.
- Combine Tools: Use different tools for different needs. For example, use Mermaid for quick drafts and Graphviz for more complex diagrams.
- Automate: Consider integrating LLMs with scripts to automate diagram generation, especially for repetitive tasks.
No matter which tool you choose—Mermaid, PlantUML, or Graphviz DOT—these methods will make diagramming faster, easier, and more accessible. Experiment with these tools, find the workflow that works best for you.
Kanwal Mehreen Kanwal is a machine learning engineer and a technical writer with a profound passion for data science and the intersection of AI with medicine. She co-authored the ebook “Maximizing Productivity with ChatGPT”. As a Google Generation Scholar 2022 for APAC, she champions diversity and academic excellence. She’s also recognized as a Teradata Diversity in Tech Scholar, Mitacs Globalink Research Scholar, and Harvard WeCode Scholar. Kanwal is an ardent advocate for change, having founded FEMCodes to empower women in STEM fields.