
5 Tools for Visualizing Machine Learning Models
Image by Editor | Midjourney
Machine learning (ML) models are built upon data. They are like the ready-to-use artifacts resulting from making sense of a dataset to uncover patterns, make predictions, or automate decisions. Whilst visualizing data is undoubtedly important across many data science processes like exploratory analysis and feature engineering, the idea of visualizing an ML model is not as straightforward: it entails understanding its structure, performance, and behavior to make decisions, often requiring specialized tools and techniques.
This article lists 5 tools you might not know to help you visualize and gain insight into the nature and operation of your ML models.
1. TensorBoard
TensorBoard is a commonly used tool for visualizing advanced ML models, primarily neural network-based models built with TensorFlow. Focused on experimentation, the tool supports graph-based model architecture visualization, tracking of training metrics like loss and accuracy, and model weights visualizations like histograms, among others. By using the appropriate design patterns like wrappers and the Keras API, TensorBoard can be also used to visualize aspects of classical ML models built with other libraries like scikit-learn. This is a fairly balanced and multi-purpose model visualization tool overall.
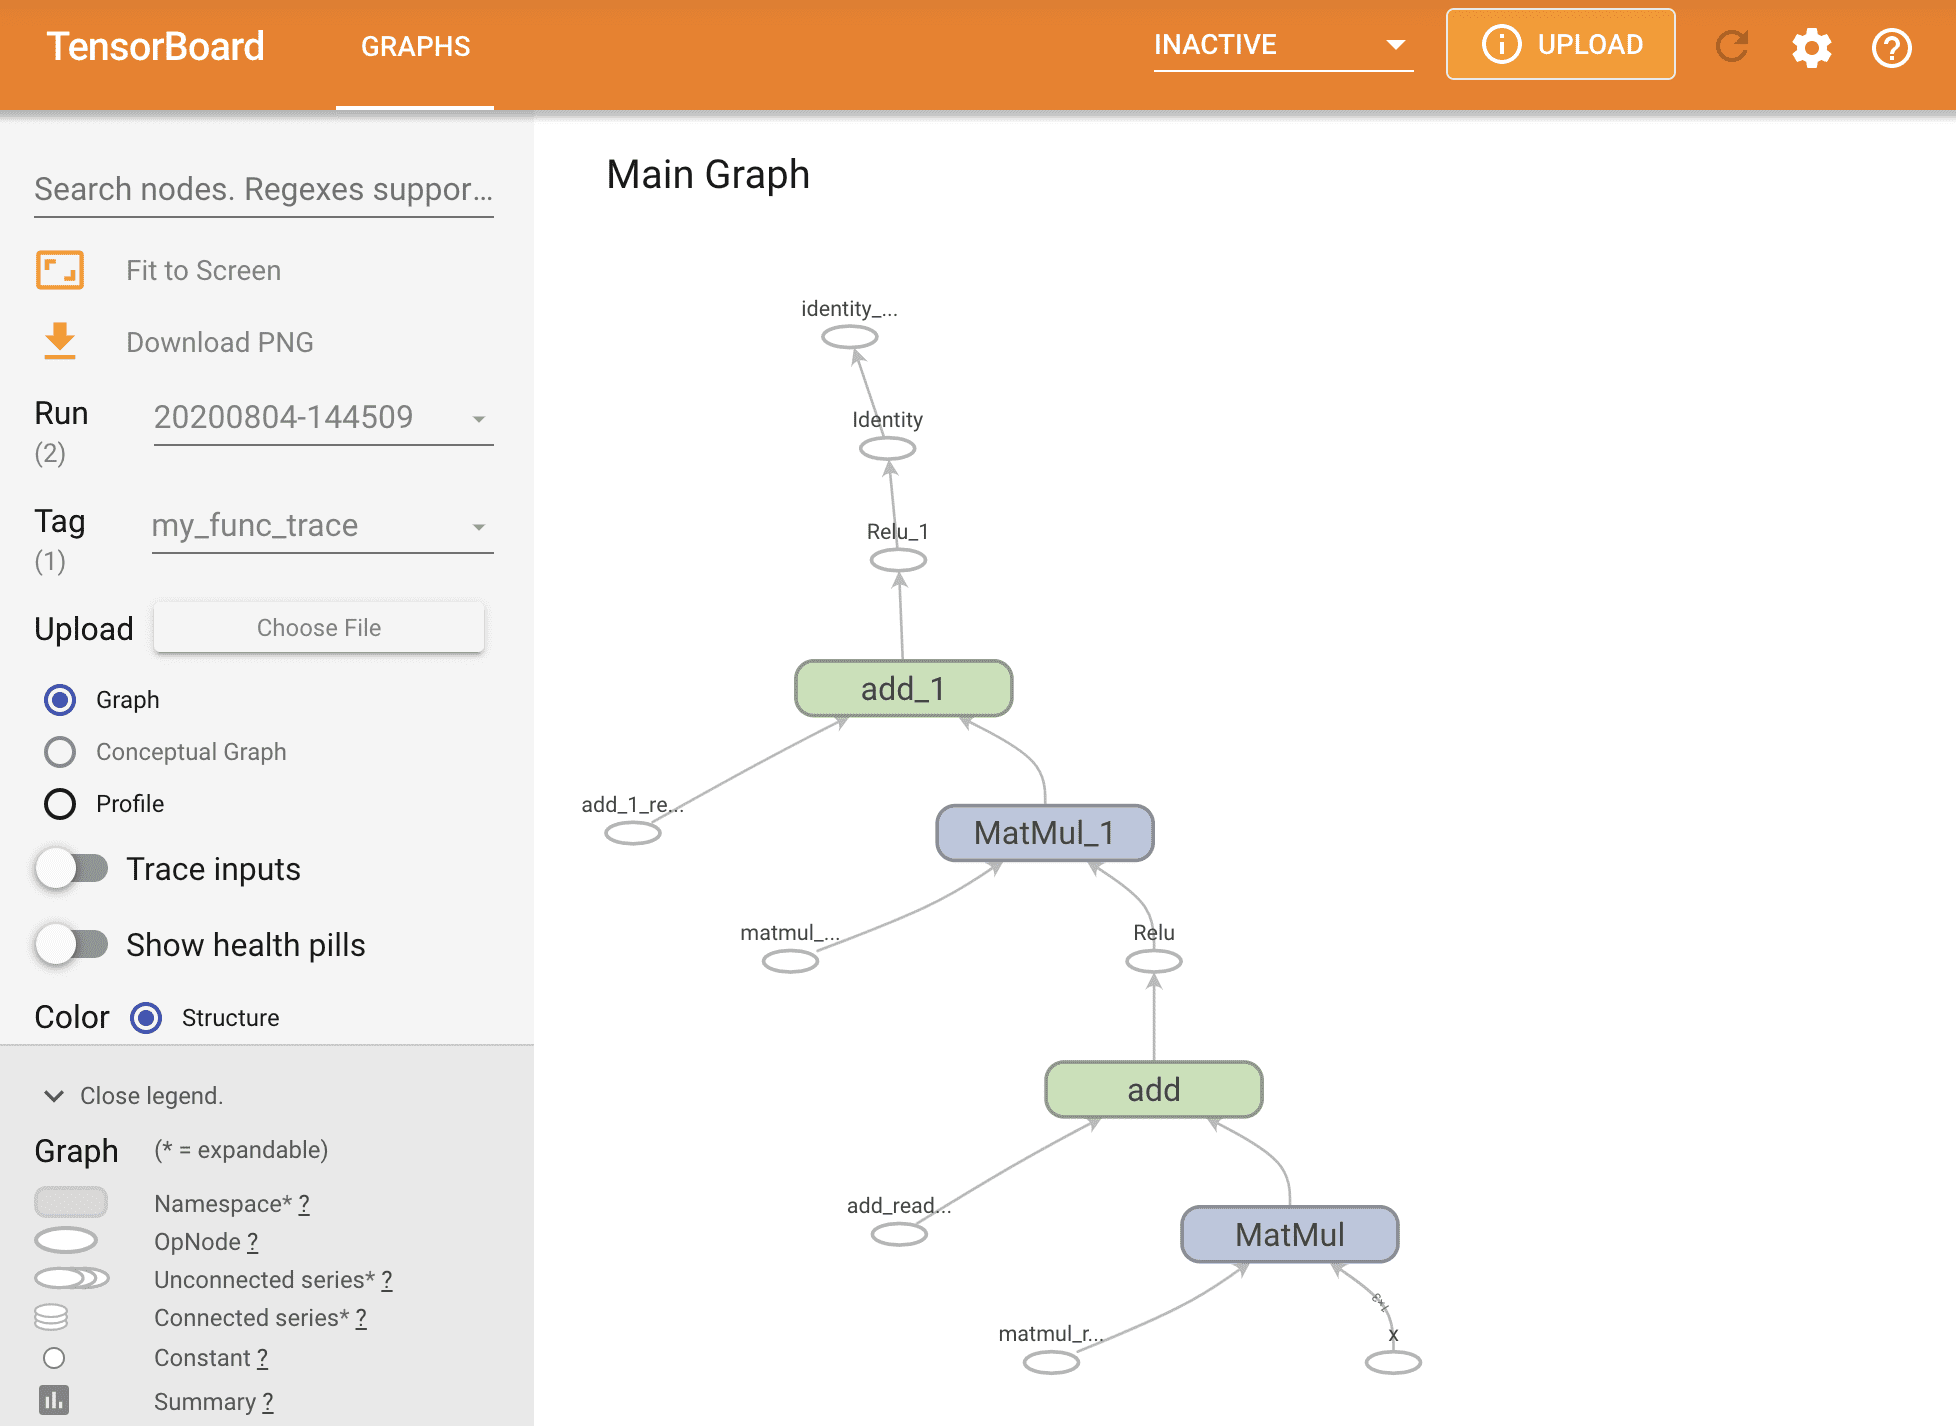
A neural network model architecture visualized with TensorBoard
Image source: tensorflow.org
2. SHAP (SHapley Additive exPlanations)
Widely associated with explainable artificial intelligence (XAI), SHAP is one of the most popular tools for understanding model predictions, being capable of visualizing and explaining how individual features in the input data influence individual predictions. It provides users with the ability to interpret both simple and complex models.
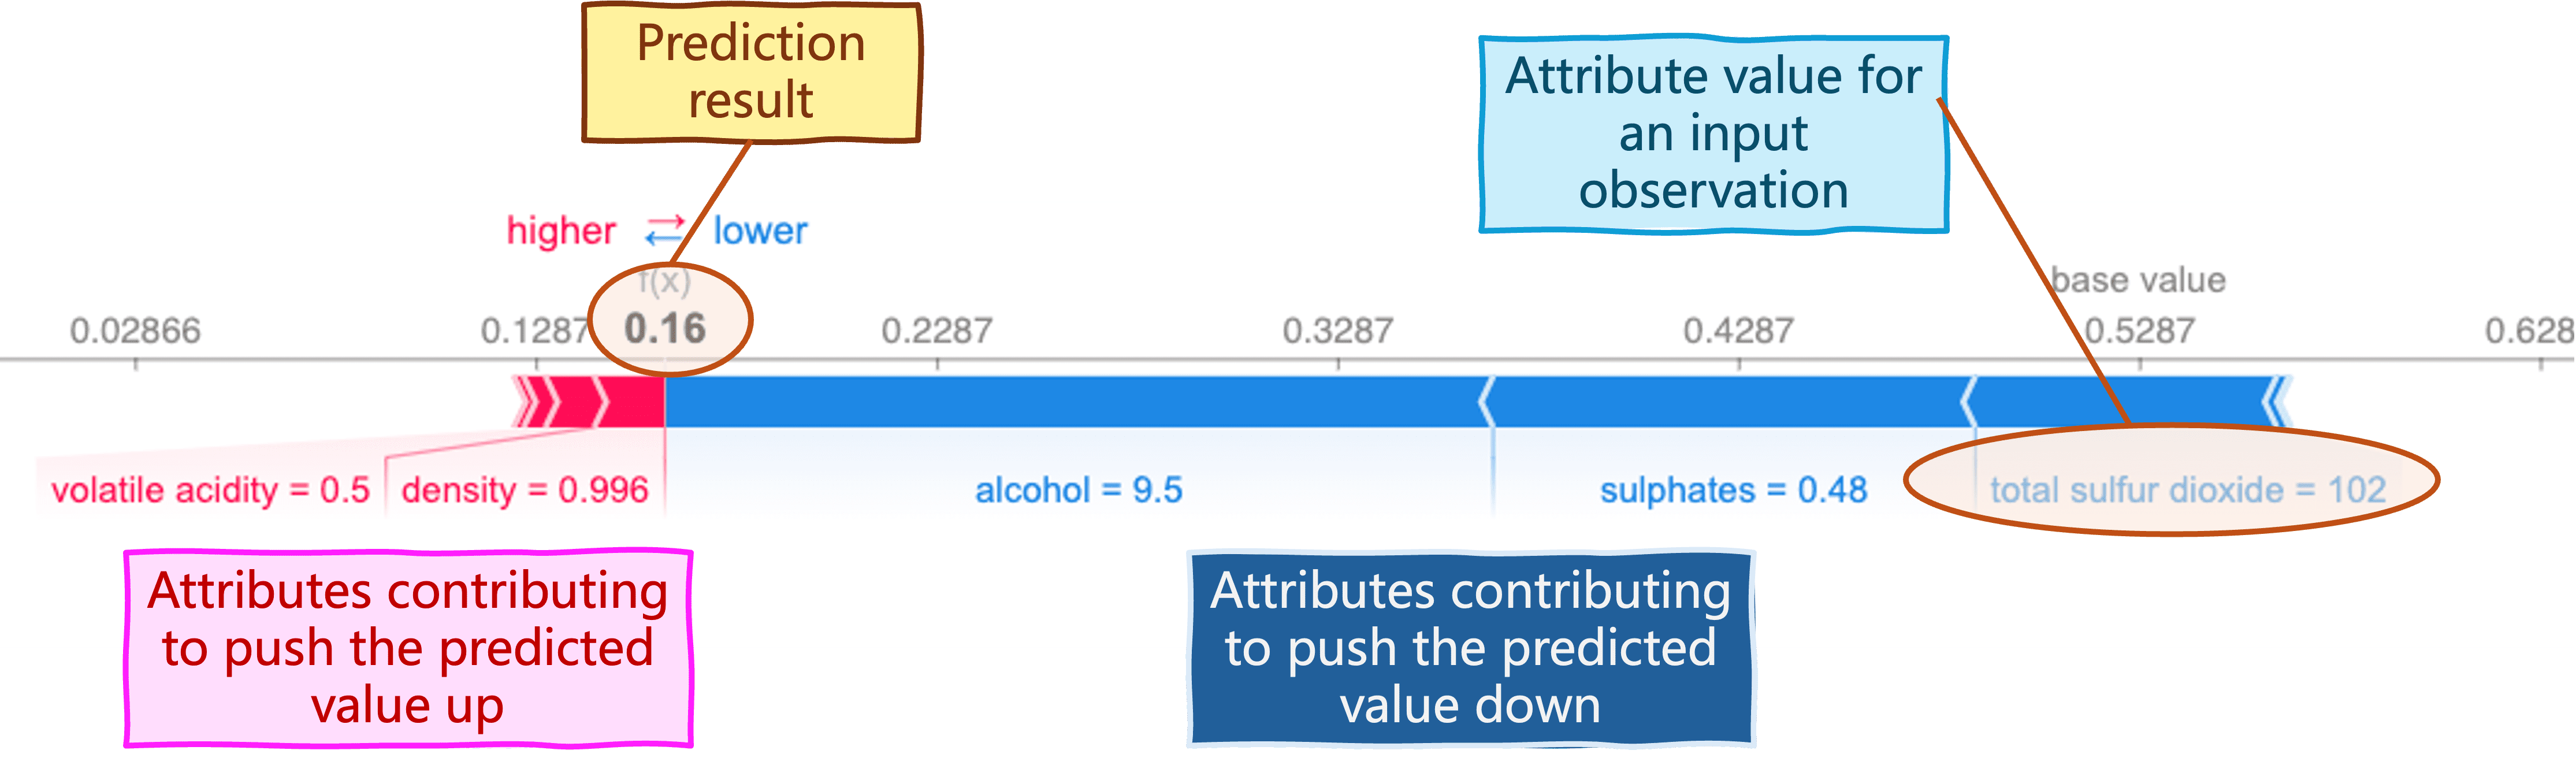
SHAP helps understand how individual predictions are made by analyzing inputs’ influence
Image by Author
3. Yellowbrick
Yellowbrick is a Python library for model diagnostics and evaluation. It extends scikit-learn to support model selection, by offering an assortment of sophisticated and highly customizable metric visualizations like learning curves, residual plots, and ROC curves. It is a very powerful tool for enhanced model evaluation but it might not be as popular as others, hence the supporting documentation available is comparatively limited.

Fine-grain metrics visualization with Yellowbrick
Image by Author
4. Netron
Netron specializes in visualizing complex deep learning model architectures, for instance, convolutional neural networks for computer vision, or natural language processing (NLP) models. By supporting multiple frameworks and formats, including TensorFlow, PyTorch, and CoreML, it is a great ally for ML engineers seeking to closely inspect deep neural network layers and operations.

Deep learning architecture visualization with Netron
Image source: github.com
5. LIME (Local Interpretable Model-agnostic Explanations)
Similar to SHAP, LIME is another popular explainability tool that provides visual, intuitive explanations for individual ML model predictions: it does so by approximating complex models with simpler, more interpretable counterparts. It is compatible with both classical and deep learning models, providing insightful explanations regardless of the techniques or algorithms used.
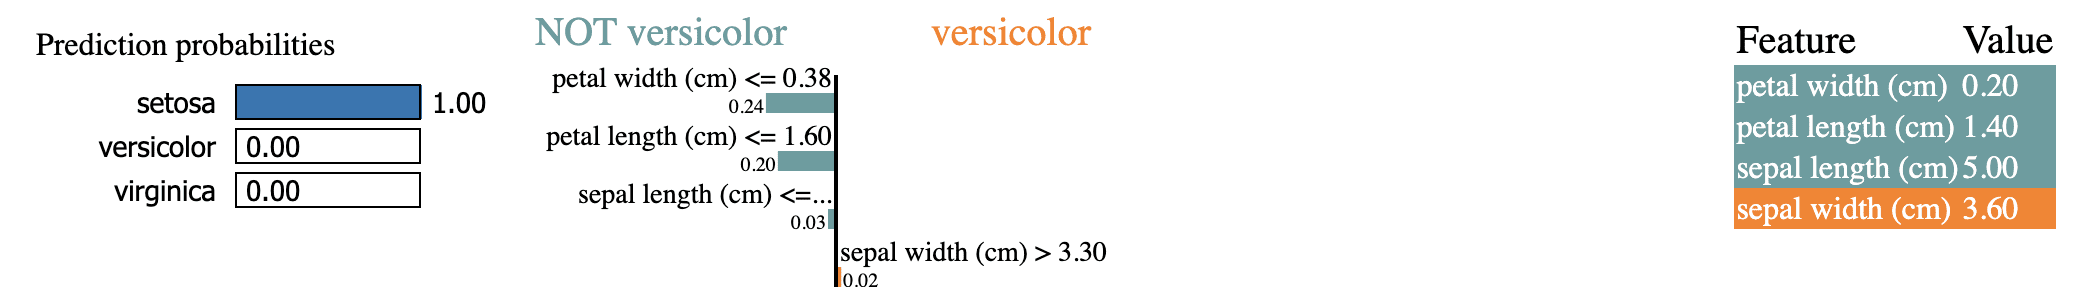
Explaining model predictions with LIME
Image by Author
Conclusion
So there you have it: 5 capable tools for visualizing machine learning models for a variety of model types and use cases. Try some of these for yourself and dig deeper than ever into your models, their inner workings, and their predictions.
About Iván Palomares Carrascosa
Iván Palomares Carrascosa is a leader, writer, speaker, and adviser in AI, machine learning, deep learning & LLMs. He trains and guides others in harnessing AI in the real world.