
Image by Editor | Midjourney
Machine learning, the “art and craftsmanship” of building systems capable of learning from data to perform a specific task by themselves, is not precisely a narrow subarea of artificial intelligence. In fact, the number and variety of algorithms and approaches to choose from are just overwhelming, and for beginners or occasional machine learning practitioners, it might be difficult to decide on which algorithm to use for a given problem. This decision is a critical step towards building the right model for your data and goals.
This article is here to help; it provides a visual, decision tree-based guide to navigate you towards the most suitable machine learning algorithm for your task, depending on the nature and complexity of your available data. Some technical and data-related concepts related to the decisions and questions to ask yourself in this process are explained along the way.
A Decision Tree Approach
Without further ado, here is the article’s protagonist: the decision tree designed to navigate you towards the right machine learning approach to look at.
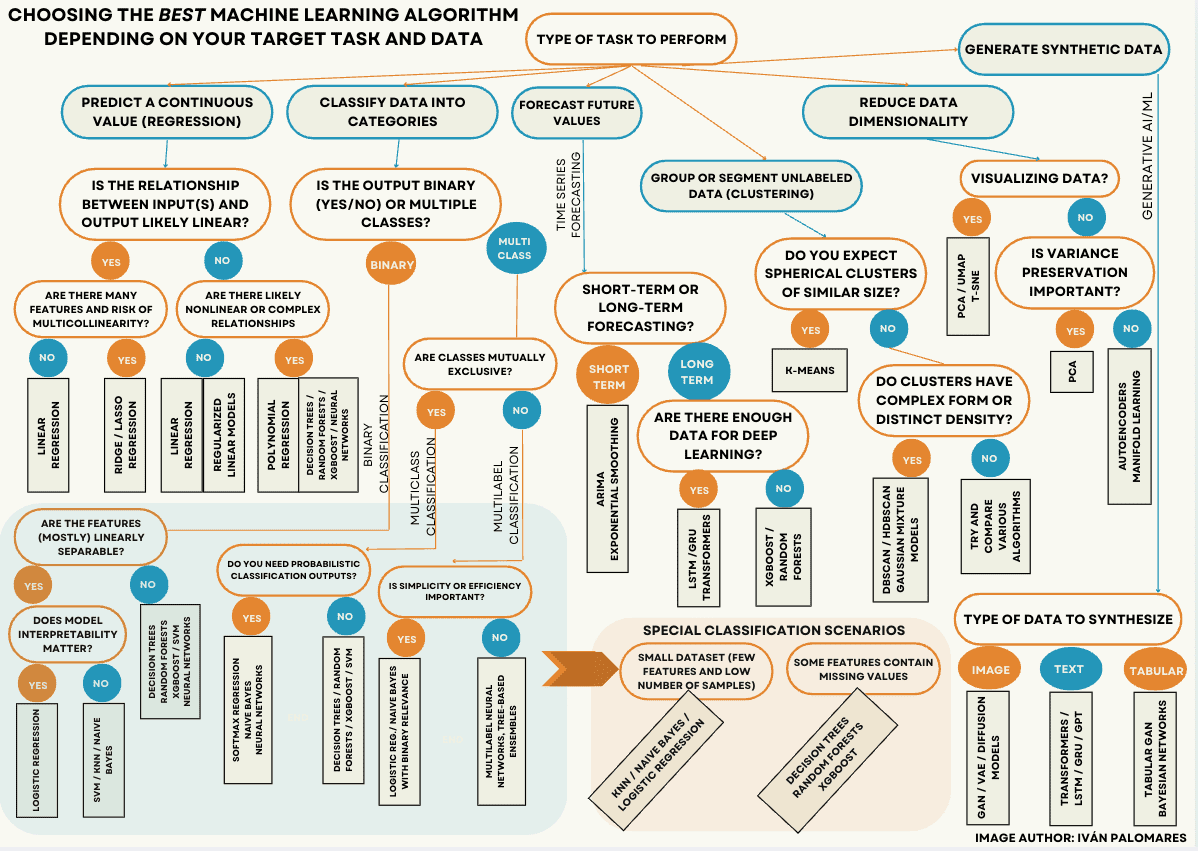
A decision tree approach to choosing the right machine learning algorithm (click to enlarge)
It may look daunting and overwhelming at first glance, but here is the good news: once you have a clear understanding of the type of task you want to perform, you’ll only need to worry about either one of the six branches and “subtrees” that from the very top node of the tree — labeled “Type of task to perform” — and ignore the rest. That’s your starting point, no matter the problem or situation.
Let’s dive deeper into some of the details and aspects discussed along the tree. Here’s a brief outline of the tasks distinguished in the diagram, from left to right.
Predictive Tasks
- Regression: do you want to predict or estimate a continuous value for an attribute (like the price of a product) based on other attributes, like the characteristics of the product? Are you trying to estimate the air temperature depending on other conditions like humidity or pressure? Then you’re looking for regression algorithms and models.
- Classification: are you trying to classify animal or plant observations into species, detecting whether an e-mail message may be spam or not, or trying to classify images depending on the object shown? Then take a look at classification approaches.
- Time series forecasting: do you have a set of temporally ordered data readings (a time series) and are you trying to predict a future value of a property or magnitude like temperature, based on the past values of that same variable (temperature history)? Then try out time series forecasting methods.
Non-Predictive Tasks
- Clustering: if you have a set of unlabeled (uncategorized) data samples and want to group or segment them into subgroups based on similarity, then clustering algorithms are exactly what you are looking for.
- Dimensionality reduction: is your data too large and you want to obtain a compact and more manageable representation of it without losing its key properties? Do you want to visualize complex data in a meaningful way? Take a glimpse at data dimensionality reduction techniques.
- New data generation: if you are looking to generate new, synthetic data that looks like existing real data, be it structured/tabular data, text, or multimedia data like images, video, and so on, look no further than cutting-edge generative models.
Once you have identified your target task, the rest of the questions to ask depend largely on the nature, properties, and complexity of the data. Here are some additional hints to help you understand some of the aspects to evaluate the data:
- Linear vs non-linear relationships among data inputs and output: choosing the right regression algorithm largely depends on whether the relationship between predictor variables (inputs) and the target variable to predict (output) is linear. For instance, predicting house prices based on square footage is an example of a linear relationship, whereas predicting a person’s health condition based on various lifestyle factors and medical history may follow a more complex, nonlinear pattern.
- Multicollinearity: this phenomenon occurs when two or more input features are highly correlated, which hints at likely redundant linear relationships. This redundancy of information can distort the accurate estimation process underlying linear regression techniques, in which case alternative methods like ridge or lasso regression are designed to reduce the impact of multicollinearity.
- Linearly separable features: in classification problems, the “ideal” (but not so common in practice) situation would be that each category of data points can be perfectly separated by a straight line or hyperplane, in which case basic classification techniques like logistic regression or linear SVM (support vector machines) can be sufficient. Meanwhile, when categories overlap or have complex boundaries far from linear, tree-based models, neural networks, and nonlinear SVMs often perform better.
- Probabilistic classification outputs: if for instance you need the likelihood that an instance belongs to each possible class rather than a single class prediction, models like softmax regression, naive Bayes, or neural networks designed with a softmax output layer are more suitable: these models calculate normalized class probabilities rather than just a single, discrete class output.
- Cluster shape and density: assumptions about the shape and density of the subgroups to identify in your data can help decide on the right clustering algorithm to apply. Cluster shape is about whether subgroups are spherical or irregular, whereas cluster density describes how tightly packed or sparse the points in each cluster are. K-means is an easy algorithm to apply, but it assumes spherical, evenly sized subgroups to be applicable, whereas DBSCAN or HDBSCAN are better at discovering clusters with more arbitrary and unevenly dense forms.
- Variance preservation: in dimensionality reduction tasks, there is typically a delicate trade-off to deal with between simplifying data as much as possible and retaining important information. Preserving most of your data’s variance is important when you want to reduce dimensions while keeping the key properties and structure in the data largely intact: this is what techniques like PCA are designed to do.
- The multifaceted role of neural networks and deep learning architectures: both “simpler” neural networks and deeper ones like LSTM, GRU, and transformers, can have multiple uses — ranging from regression and classification to object detection in images, complex time series forecasting in long term, and data generation. This is why they can be the way to go in every type of machine learning task, namely when the data is particularly large, complex, and challenging.
Wrapping Up
This article provided a guide to choosing the right machine learning algorithm to use for addressing several types of problems under different types of available data, guiding you towards the ideal choice through a decision tree approach.
Iván Palomares Carrascosa is a leader, writer, speaker, and adviser in AI, machine learning, deep learning & LLMs. He trains and guides others in harnessing AI in the real world.