
Image by Editor | Midjourney
In the past, businesses grouped customers based on simple things like age or gender. Now, machine learning has changed this process. Machine learning algorithms can analyze large amounts of data. In this article, we will explore how machine learning improves customer segmentation.
Introduction to Customer Segmentation
Customer segmentation divides customers into different groups. These groups are based on similar traits or behaviors. The main goal is to understand each group better. This helps businesses create marketing strategies and products that fit each group’s specific needs.
The customers can be divided into groups based on several criteria:
- Demographic Segmentation: Based on factors such as age, gender and occupation.
- Psychographic Segmentation: Focuses on customer lifestyles and interests.
- Behavioral Segmentation: Analyzes customer behaviors such as brand loyalty and usage frequency.
- Geographic Segmentation: Divides customers based on their geographical location.
Customer segmentation offers several advantages for businesses:
- Personalized Marketing: Businesses can send specific messages for each groups of customers.
- Improved Customer Retention: Organizations can identify the preferences of customers and make them loyal customers.
- Enhanced Product Development: Segmentation helps to understand what products customers want.
Machine learning Algorithms for Customer Segmentation
Machine learning uses several algorithms to categorize customers based on their features. Some commonly used algorithms include:
- K-means Clustering: Divides customers into clusters based on similar features.
- Hierarchical Clustering: Organizes customers into a tree-like hierarchy of clusters.
- DBSCAN: Identifies clusters based on density of points in data space.
- Principal Component Analysis (PCA): Reduces the dimensionality of data and preserves important information.
- Decision Trees: Divides customers based on a series of hierarchical decisions.
- Neural Networks: Learn complex patterns in data through interconnected layers of nodes.
We will use K-means algorithm to segment customers into various groups.
Implementing K-means Clustering Algorithm
K-means clustering is an unsupervised algorithm. It operates without any predefined labels or training examples. This algorithm is used to group similar data points in a dataset. The goal is to divide the data into clusters. Each cluster contains similar data points. Let’s see how this algorithm works.
- Initialization: Choose the number of clusters (k). Initialize k points randomly as centroids.
- Assignment: Assign each data point to the nearest centroid and form the clusters.
- Update Centroids: Calculate the mean of all data points assigned to each centroid. Move the centroid to this mean position.
Repeat steps 2 and 3 until convergence.
In the following sections, we are going to implement K-means clustering algorithm to group customers into clusters according to different features.
Data Preparation
Let’s explore the customer dataset. Our dataset has around 5,00,000 data points.
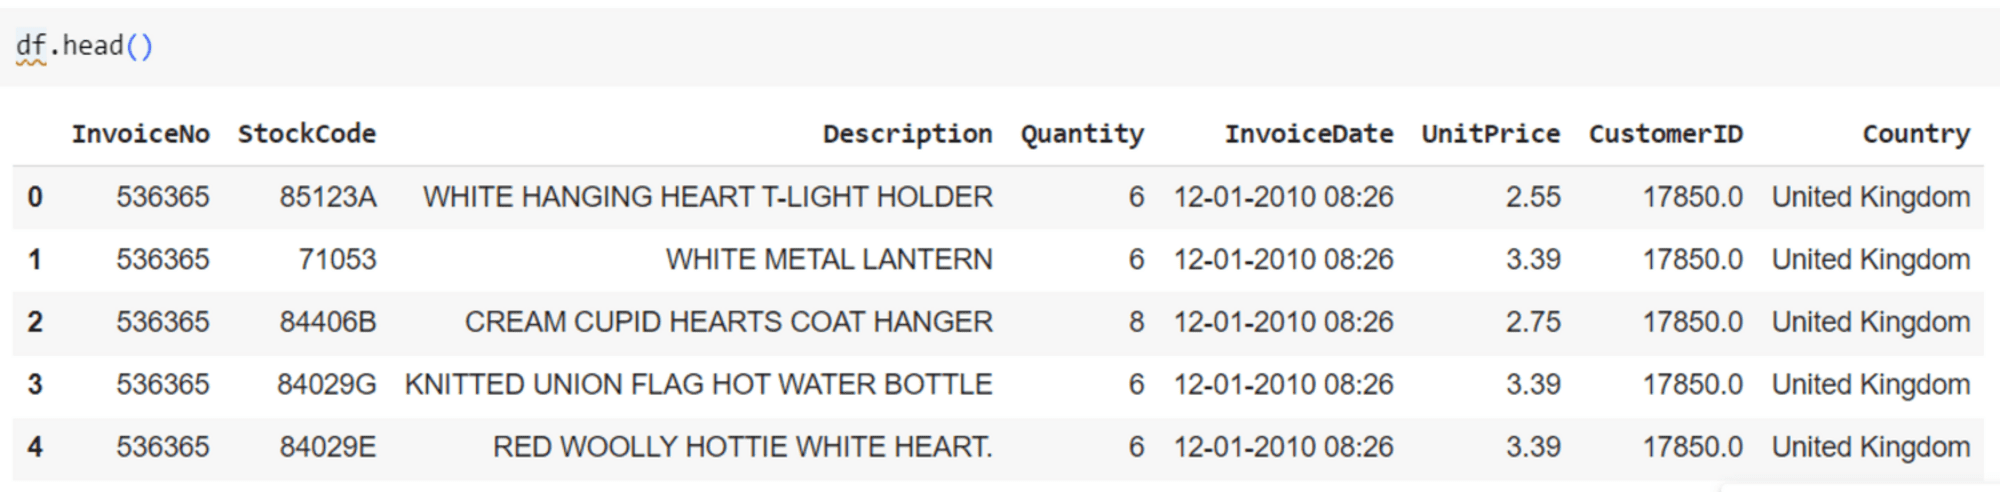
Customer dataset
The missing values and duplicates are removed and three features (‘Quantity’, ‘UnitPrice’, ‘CustomerID’) are selected for clustering.
|
1 2 3 4 5 6 7 8 9 10 11 12 13 14 15 16 17 |
import pandas as pd from sklearn.preprocessing import StandardScaler
# Load the dataset (replace ‘data.csv’ with your actual file path) df = pd.read_csv(‘userdata.csv’)
# Data cleaning: remove duplicates and handle missing values df = df.drop_duplicates() df = df.dropna()
# Feature selection: selecting relevant features for clustering selected_features = [‘Quantity’, ‘UnitPrice’, ‘CustomerID’] X = df[selected_features]
# Normalization (standardization) scaler = StandardScaler() X_scaled = scaler.fit_transform(X) |
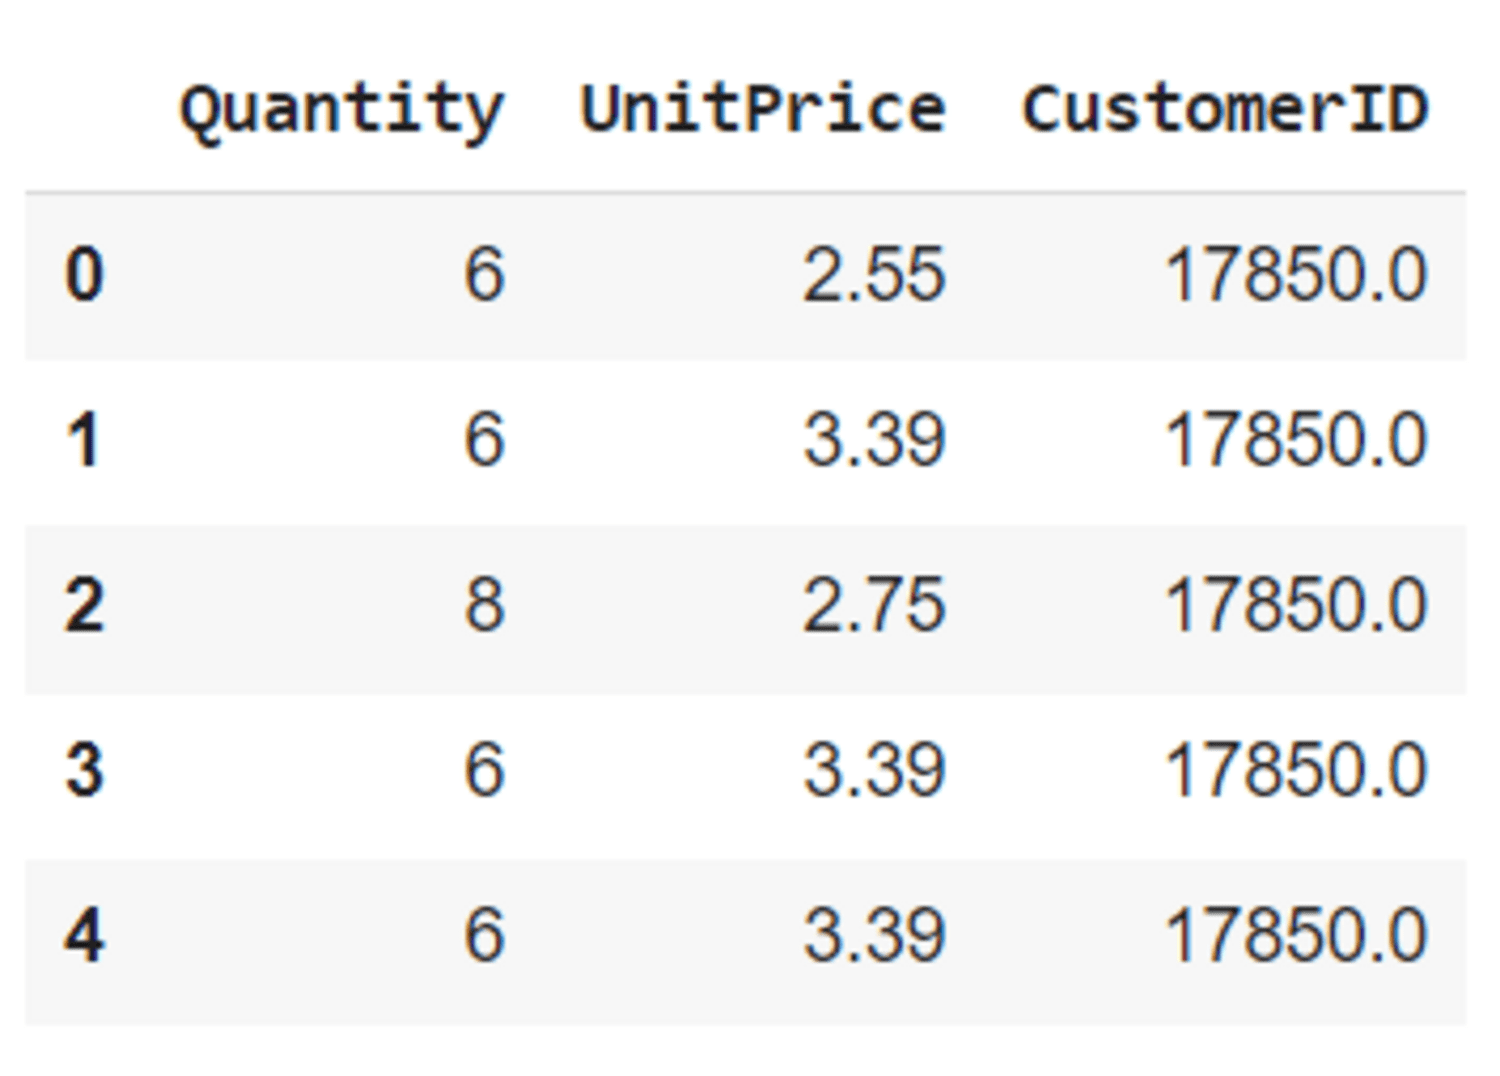
Pre-processed dataset
Hyperparameter Tuning
One challenge in K-means clustering is to find out the optimal number of clusters. The elbow method help us in doing so. It plots the sum of squared distances from each point to its assigned cluster centroid (inertia) against K. T Look for the point where the inertia no longer decreases significantly with increasing K. This point is called the elbow of the clustering model. It suggests a suitable K value.
|
1 2 3 4 5 6 7 8 9 10 11 12 13 14 15 16 17 18 19 20 21 |
# Determine the optimal number of clusters using the Elbow Method def determine_optimal_clusters(X_scaled, max_clusters=10): distances = []
for n in range(2, max_clusters+1): kmeans = KMeans(n_clusters=n, random_state=42) kmeans.fit(X_scaled) distances.append(kmeans.inertia_)
plt.figure(figsize=(7, 5)) plt.plot(range(2, max_clusters+1), distances, marker=‘o’) plt.title(‘Elbow Method’) plt.xlabel(‘Number of clusters’) plt.ylabel(‘Sum of squared distances’) plt.xticks(range(2, max_clusters+1)) plt.grid(True) plt.show()
return distances
distances = determine_optimal_clusters(X_scaled) |
We can generate an inertia vs number of clusters plot using the above code.

Elbow method
At K=1, inertia is at the highest. From K=1 to K=5, the inertia decreases steeply. Between K=5 to K=7, the curve decreases gradually. Finally, at K=7, it becomes stable, so the optimal value of K is 7.
Visualizing Segmentation Results
Let’s implement K-means clustering algorithm and visualize the results.
|
1 2 3 4 5 6 7 8 9 10 11 12 13 14 15 16 17 18 19 20 21 22 23 24 25 26 27 28 |
# Apply K-means clustering with the chosen number of clusters chosen_clusters = 7 kmeans = KMeans(n_clusters=chosen_clusters, random_state=42) kmeans.fit(X_scaled)
# Get cluster labels cluster_labels = kmeans.labels_
# Add the cluster labels to the original dataframe df[‘Cluster’] = cluster_labels
# Visualize the clusters in 3D fig = plt.figure(figsize=(12, 8)) ax = fig.add_subplot(111, projection=‘3d’)
# Scatter plot for each cluster for cluster in range(chosen_clusters): cluster_data = df[df[‘Cluster’] == cluster] ax.scatter(cluster_data[‘Quantity’], cluster_data[‘UnitPrice’], cluster_data[‘CustomerID’], label=f‘Cluster cluster’, s=50)
ax.set_xlabel(‘Quantity’) ax.set_ylabel(‘UnitPrice’) ax.set_zlabel(‘CustomerID’)
# Add a legend ax.legend() plt.show() |
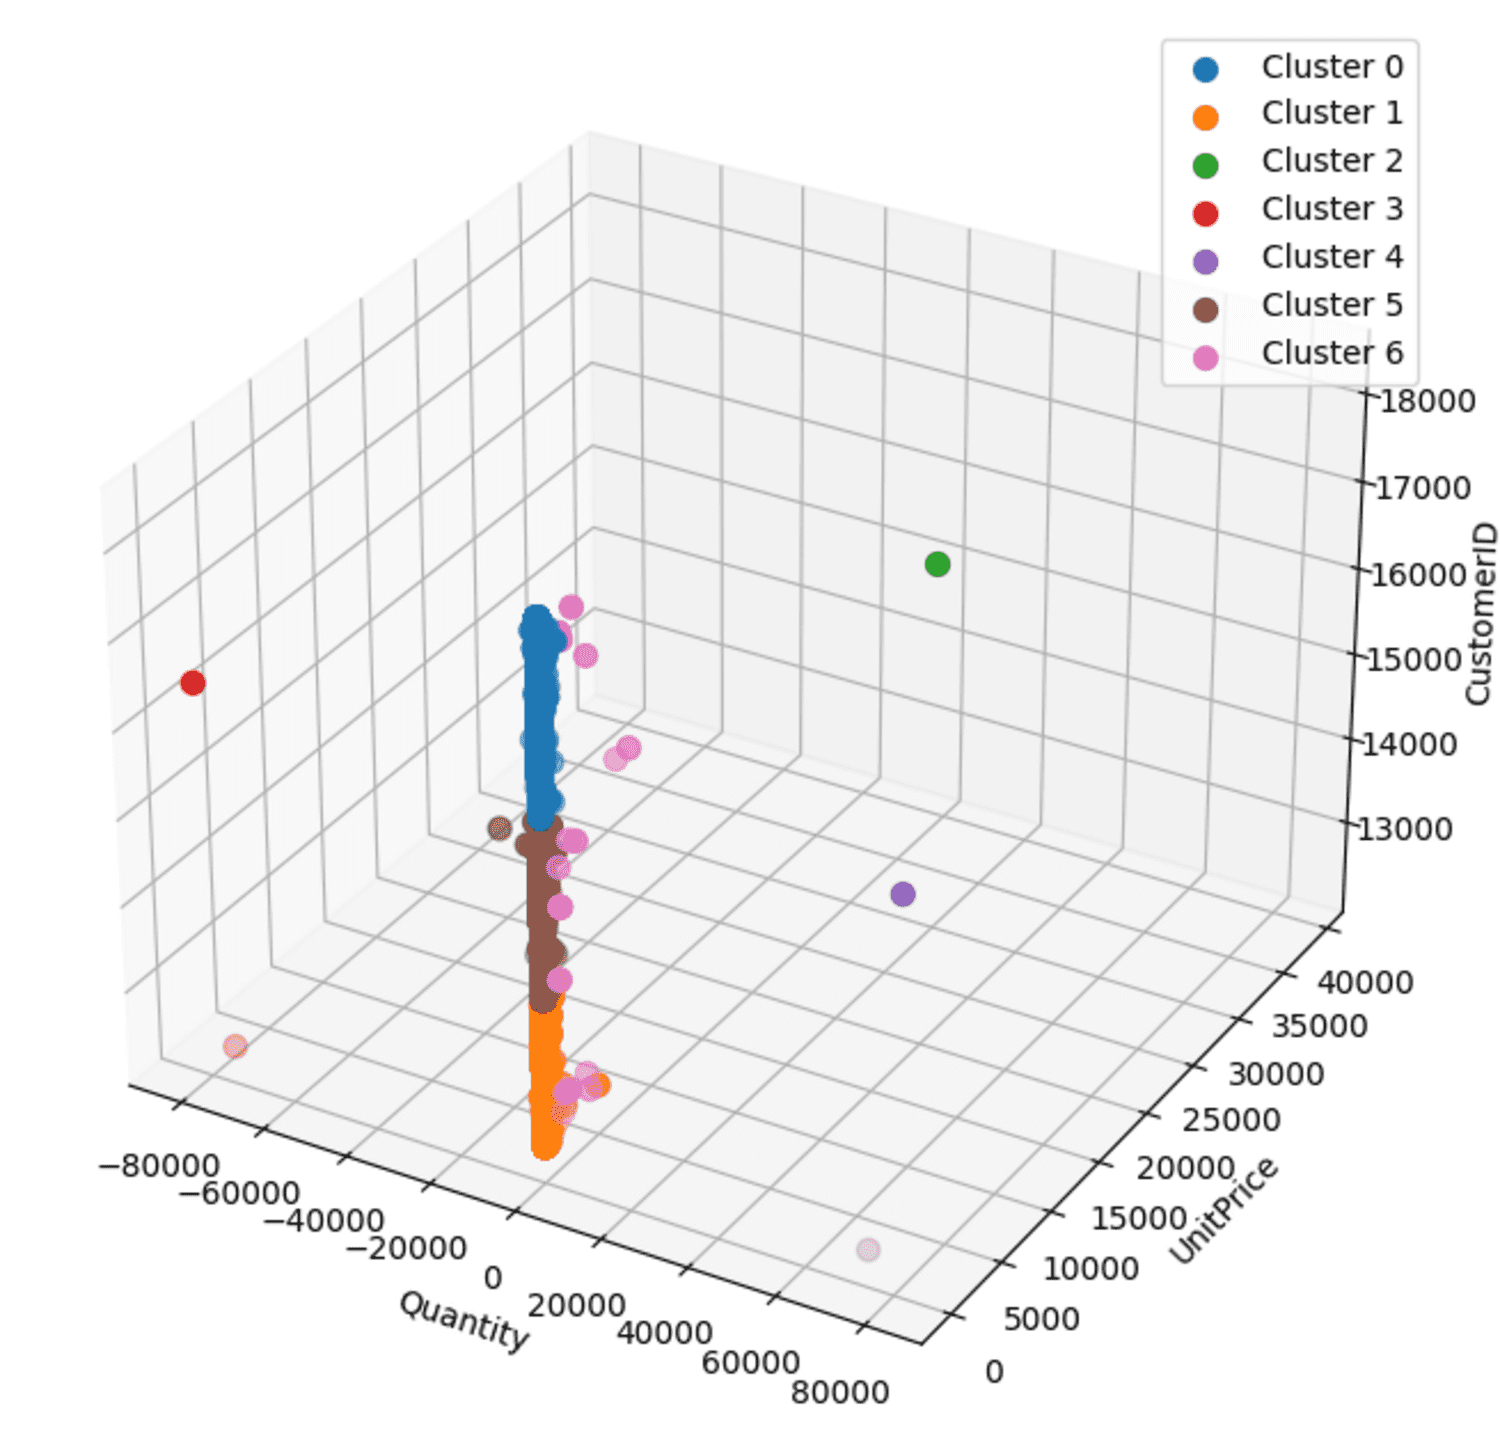
Scatter plot
The 3D scatter plot visualizes the clusters based on ‘Quantity’, ‘UnitPrice’, and ‘CustomerID’. Each cluster is differentiated by color and labeled accordingly.
Conclusion
We have discussed customer segmentation using machine learning and its benefits. Furthermore, we showed how to implement the K-means algorithm to segment customers into different groups. First, we found a suitable number of clusters using the elbow method. Then, we implemented the K-means algorithm and visualized the results using a scatter plot. Through these steps, companies can segment customers into groups efficiently.
Get Started on The Beginner’s Guide to Data Science!

Learn the mindset to become successful in data science projects
…using only minimal math and statistics, acquire your skill through short examples in Python
Discover how in my new Ebook:
The Beginner’s Guide to Data Science
It provides self-study tutorials with all working code in Python to turn you from a novice to an expert. It shows you how to find outliers, confirm the normality of data, find correlated features, handle skewness, check hypotheses, and much more…all to support you in creating a narrative from a dataset.
Kick-start your data science journey with hands-on exercises
See What’s Inside
About Jayita Gulati
Jayita Gulati is a machine learning enthusiast and technical writer driven by her passion for building machine learning models. She holds a Master’s degree in Computer Science from the University of Liverpool.